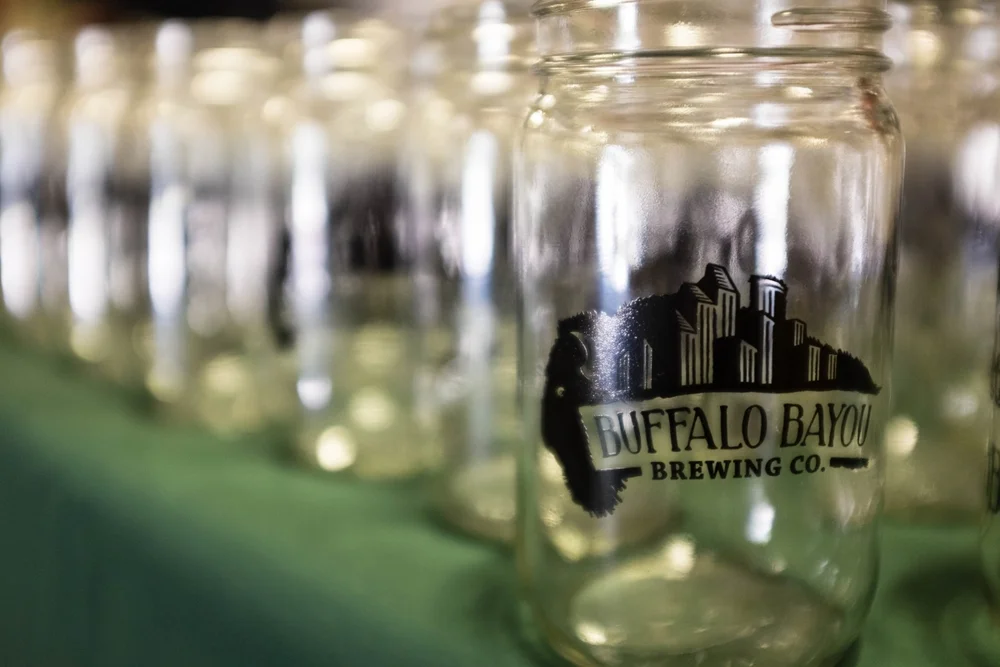
Testing the Coaster Campaign at Buffalo Bayou Brewery
Brian Barr
In case you missed it, this summer has been one of civic duty for Data Design Co_. We partnered with January Advisors on a series of get-out-the-vote projects for the 2015 Houston mayoral elections, most notably the Pop Up Poll we built in June. This past Saturday we were excited continue the partnership with a test drive of the Coaster Campaign at Buffalo Bayou Brewery.
Our last blog post was about the manufacturing process for our coasters, so this blog will focus on the experiment itself. As mentioned previously, the goal of the Coaster Campaign is to determine if providing political information in nonpolitical environments will spark conversations and eventually influence Houstonians to turn out at the polls. To that end, we picked six statistics (3 with a negative spin, 3 with a positive spin), to display on coasters for our test run.
- Only 19% of registered Houstonians voted in the last open mayoral election.
- Houstonians recycle 6% of their waste compared to the national average of 34%
- The City of Houston has a pension problem
- The Houston region has had consistently higher job growth rates than the rest of the country for the last several years
- Houston has the largest amount of parkland out of any of the 10 most populous cities in the US
- Houston is the largest city to eliminate veteran homelessness.
To test the effectiveness of the coasters, we used the Pop Up Poll mechanism that we developed earlier in the summer. Given the question "How has this coaster influenced your likelihood of voting in the local elections in November?", patrons were asked to drop their coasters in a slots labeled "Less likely to vote", "No change", and "More likely to vote"
The data from the poll can be found below, but before you jump to conclusions, there are a few observations from administering the poll that may affect the outcome of the poll. One common thing that we heard was that people who were going to vote already, weren't affected by the coaster and thus answered "No change". We also noticed that those who answered "More likely to vote." seemed to be having more discussion about the coaster and the information it contained, whereas those who voted "No Change" or "Less likely to vote" oftentimes had put the coaster in their pocket or another place where it was not in sight. We also seemed to have a pretty high turnover rate with 350 coasters being passed out, yet only 152 votes were cast. Houston, it seems, really does have a voter turnout problem.
Finally, we wanted to track the effect of statistics with a positive spin versus those with a negative spin. It is pretty clear from the data that the positive statistics were less effective. In every case the positive statistics had a higher percentage of "No Change", and a lower percentage of "More likely to vote" than any of the negative statistics.
All of this information is interesting as it points to a population that could be influenced to turn out at the polls. This was certainly a great start into measuring the effectiveness of a non-traditional marketing tool, but there is still work to be done to figure out the number of new voters this would create as opposed to those who were going to vote already. This may require a redesign of the coasters or the experiment, but if these results are anything to go by then this approach could have a measurable effect on the 2015 Houston Mayoral elections in this fall.


