
20,000 Feet Under the Sea: Our Print Debut for The Atlantic
Brian Barr
Careful observers of The Atlantic may have noticed a familiar name in the pages of this month’s issue. In our print debut, Data Design Co_ created a visualization of the Marianas Trench for an article appearing in the Jan/Feb 2020 issue entitled “20,000 Feet Under the Sea” by Wil S. Hylton.

The article focuses on the decisions being made about how to regulate, if at all, the process of mining the deep sea for precious metals and other natural resources. Very little is actually known about the ecosystems of the deep sea because the extreme temperatures and pressures make it difficult to study. It is also notoriously difficult to picture because of the sheer scale and lack of light. Neither of these pieces make for prime decision making conditions when it comes to regulatory policy. Fortunately, visualization is our specialty.
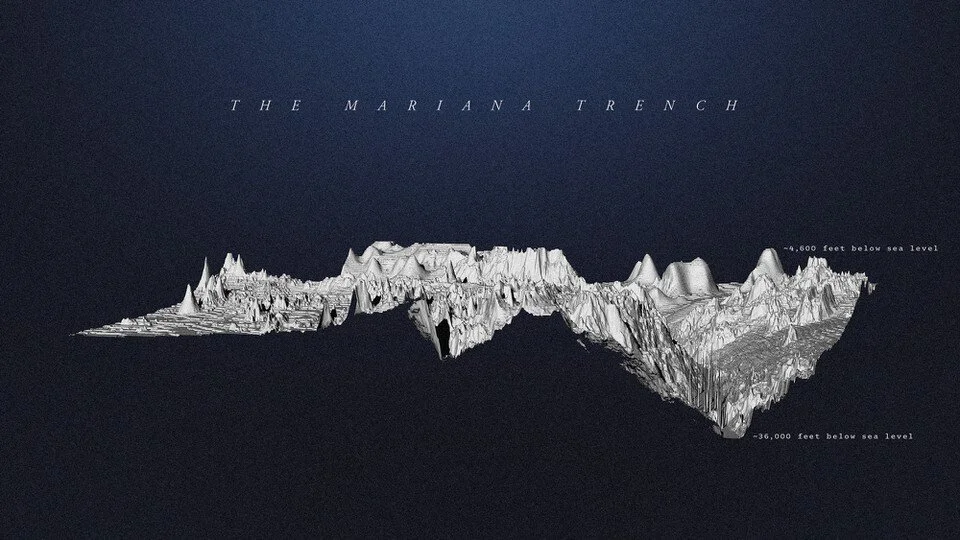
Using bathymetric data from NOAA and some GIS magic we were able to create a 3D model of the Marianas Trench. The scale is still difficult to portray, but for reference, the difference in depth between the points in the image is ~32,000 feet. Mt. Everest, the tallest mountain on Earth sits at about 29,000 feet above sea level. There is some truly magnificent topography beneath the waves.
We really enjoyed putting this illustration together for The Atlantic, and if you haven’t already we highly encourage you to pick up the issue while it is still on newstands. If you are in to deep sea exploration, we actually have a product, the Trench Mail Sorter, that highlights cross-sections of the oceans deepest trenches. The research for that project inspired this work for the Atlantic. If you are in to visualizations in general, stick around, check out some of our past blogs and products, and get ready for more great work in the future.